机器学习篇 | 分类模型-逻辑回归 (Logistic Regression)
简单来说, 逻辑回归(Logistic Regression)是一种用于解决二分类(0 or 1)问题的机器学习方法,用于估计某种事物的可能性。 比如某用户购买某商品的可能性,某病人患有某种疾病的可能性,以及某广告被用户点击的可能性等。
逻辑回归虽然称为回归,实则是一个二分类模型。
sigmod 函数
逻辑回归的核心为sigmod 函数 :
\[h_{\theta}(x) = \frac{1}{1+e^{-z}}\]对于逻辑回归任务,样本集可以分类正负两种样本类型,例如对于识别猫类型的图片样本, 对于是猫图片可以定义为正向样本(值为1), 对于非猫照片可以定义为负向样本(值为0).
在理想情况下,当模型应用到样本里面时 :
- 对于正向样本 : $h_{\theta}(x) \to 1 (z \to -\infty)$
- 对于负向样本 : $h_{\theta}(x) \to 0 (z \to +\infty)$
对于参数 $z$ :
\[z=\theta^{T}x\]- $\theta$ 为模型参数
- $x$ 为样本的特征向量
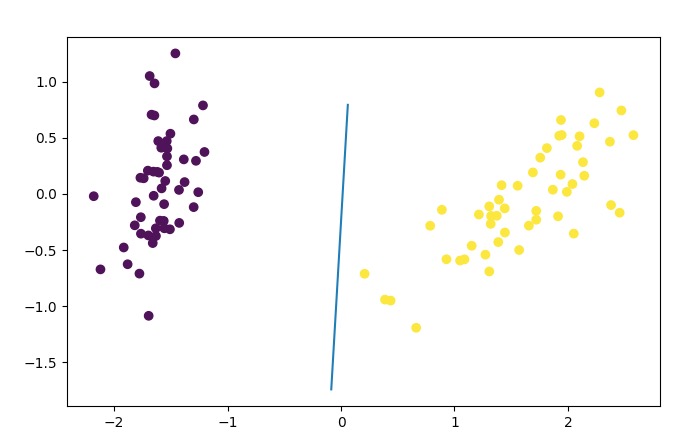
$z=\theta^{T}x$ 的几何意义为, 寻找一个 $\theta^{T}x = 0$, 切分样本集, 使得正负样本集分别位于线性分割的两边, 并且尽量远离分割线。
模型
对于数据样本, 我们取 $y$ 标识样本实际的类型:
- 对于正向样本 $y = 1$
- 对于负向样本 $y = 0$
在理想情况下, 我们期望训练得到一个好的模型,对于任意的特征向量$x$与样本标签$y$, 都有$[y-h_{\theta}(x)]\to 0$
建立模型
我们可以用概率角度来思考这个问题, 上述问题可以有 :
\[\begin{cases} p(y=1|x;\theta) = h_{\theta}(x)\\ p(y=0|x;\theta) = 1- h_{\theta}(x)\\ \end{cases}\]统一一下, 类似0-1分布的样式表示:
上述问题我们想让所以对于任意的特征向量$x$与样本标签$y$, 都有$[y-h_{\theta}(x)]\to 0$, 等价为对于任意特征向量 $x$,有 $p(y|x;\theta) \to 1$(最大化概率) 这便是一个极大似然问题,引入似然函数:
\[L(\theta) = {\max}_{\theta} \prod_{i=1}^{m}h_{\theta}(x_i)^{y_{i}}[1-h_{\theta}(x_i)]^{(1-y_i)}\]转对数似然 :
\[l(\theta) = {\max}_{\theta} \ln L(\theta) = {\max}_{\theta} \sum_{i=1}^{m} \lbrace y_{i}\ln h_{\theta}(x_i) + (1-y_{i})\ln [1-h_{\theta}(x_i)] \rbrace\]定义损失函数
对于这个优化问题,我们使用梯度下降法来解决这个问题 :
定义损失函数 : $J(\theta) = -\frac{1}{m}l(\theta)$
梯度下降法
关于梯度下降的公式推导 :
\[J(\theta) = -\frac{1}{m}\sum_{i=1}^{m} \lbrace y_{i}\ln h_{\theta}(x_i) + (1-y_{i})\ln[1-h_{\theta}(x_i)] \rbrace\] \[\frac{\partial J(\theta)}{\partial \theta} = - \frac{1}{m} \sum_{i=1}^{m} \lbrace y_{i} \frac{1}{h_{\theta}(x_{i})} \frac{\partial h_{\theta}(x_{i})}{\partial \theta} - (1-y_{i})\frac{1}{1-h_{\theta}(x_{i})} \frac{\partial h_{\theta}(x_{i})}{\partial \theta} \rbrace\] \[= -\frac{1}{m} \sum_{i=1}^{m} \lbrace y_{i} \frac{1}{h_{\theta}(x_{i})} - (1-y_{i}) \frac{1}{1-h_{\theta}(x_i)}\rbrace \frac{\partial h_{\theta}(x_i)}{\partial \theta}\] \[= -\frac{1}{m} \sum_{i=1}^{m} \lbrace y_{i} \frac{1}{h_{\theta}(x_{i})} - (1-y_{i}) \frac{1}{1-h_{\theta}(x_i)}\rbrace h_{\theta}(x_i)[h_{\theta}(x_i)] \frac{\partial {\theta}^{T}x_i}{\partial \theta}\] \[= -\frac{1}{m} \sum_{i=1}^{m} \lbrace y_{i}[ 1- h_{\theta}(x_{i})] - (1-y_i) h_{\theta}(x_{i}) \rbrace \frac{\partial {\theta}^{T}x_i}{\partial \theta}\] \[= \frac{1}{m} \sum_{i=1}^{m} [h_{\theta}(x_{i}) - y_i] \frac{\partial {\theta}^{T}x_i}{\partial \theta}\]所以对于单个分量 ${\theta}_j$ 有
\[\frac{\partial J(\theta)}{\partial {\theta}_{j}} = \frac{1}{m} \sum_{i=1}^{m} [h_{\theta}(x_{i}) - y_i]x_{i}^{j}\]优化方法
\[\theta_j := \theta_j - \alpha \frac{1}{m} \sum_{i=1}^{m} [h_{\theta}(x_{i}) - y_i]x_{i}^{j}\]$\alpha$ 为学习率
手撸代码实例
- 依赖包加载
1
2
3
4
5
import numpy as np                                            # 矩阵工具
from sklearn.datasets import load_iris                        # 莺尾花数据集
from sklearn.model_selection import train_test_split          # 切分训练测试数据
from sklearn.decomposition import PCA                         # PCA 降维
import matplotlib.pyplot as plt                               # 绘图工具
sigmod函数包
1
2
3
4
5
6
7
8
9
10
11
12
13
14
15
def sigmod_func(w:np, x:np) -> np :
    """
    sigmod 函数
    :param w: 权重向量
    :param x: 特征向量
    :return:
    """

    z = np.dot(w.T, x)

    try :
        y = 1/(1+ np.e**(-z))
        return y[0]
    except Exception as e :
        print("error : {0} - {1}".format(e, np.e**(-z)))
- 逻辑回归模型训练
b 的作用是起到了增加一个偏置项, 对于 sigmod 函数中, 另 $z=\theta^{T}x + b$
1
2
3
4
5
6
7
8
9
10
11
12
13
14
15
16
17
18
19
20
21
22
23
24
25
26
27
28
29
30
31
32
33
34
35
36
37
38
39
40
41
42
43
44
45
46
47
48
49
50
51
def model(X:np, Y:np) -> np :

    # 初始化参数
    v_size = X.shape[1] + 1
    simple_size = X.shape[0]

    w = np.linspace(0,0, v_size).reshape(-1, 1) # 参数
    e = 0.001   # 学习率
    l2_e = 0.001
    itera = 100 # 重复学习次数
    batch = 20 # 单次学习量

    # 拼接一个偏置
    b = np.linspace(1, 1, simple_size)
    new_x = np.column_stack((X, b))

    for _ in range(0, itera) :
        loss_count = 0

        for i in range(0, simple_size, batch) :
            start_i = i
            stop_i = min(i + batch, simple_size)
            # 提取训练数据
            batch_x = new_x[start_i:stop_i, :]
            batch_y = Y[start_i:stop_i]

            # 计算预测值
            y_hat = sigmod_func(w, batch_x.T)

            # 梯度下降法计算新的参数
            y_loss = (y_hat - batch_y).reshape(-1, 1)
            new_w = np.empty((v_size, 1))
            count = y_loss.shape[0]

            loss_count = loss_count + np.sum(y_loss)

            for j in range(0, v_size) :
                batch_x_j = batch_x[:, j].reshape(-1, 1)

                loss_metric = 1/count * np.dot(y_loss.T, batch_x_j)[0,0]

                # l2正则化
                l2_reg = l2_e / count * w[j, 0]

                # 计算每个分量的梯度
                new_w[j,0] = w[j,0] - e * loss_metric + l2_reg
            w = new_w

        print("loss : {0}".format(loss_count / simple_size))

    return w


