机器学习篇 | 多分类模型-Softmax
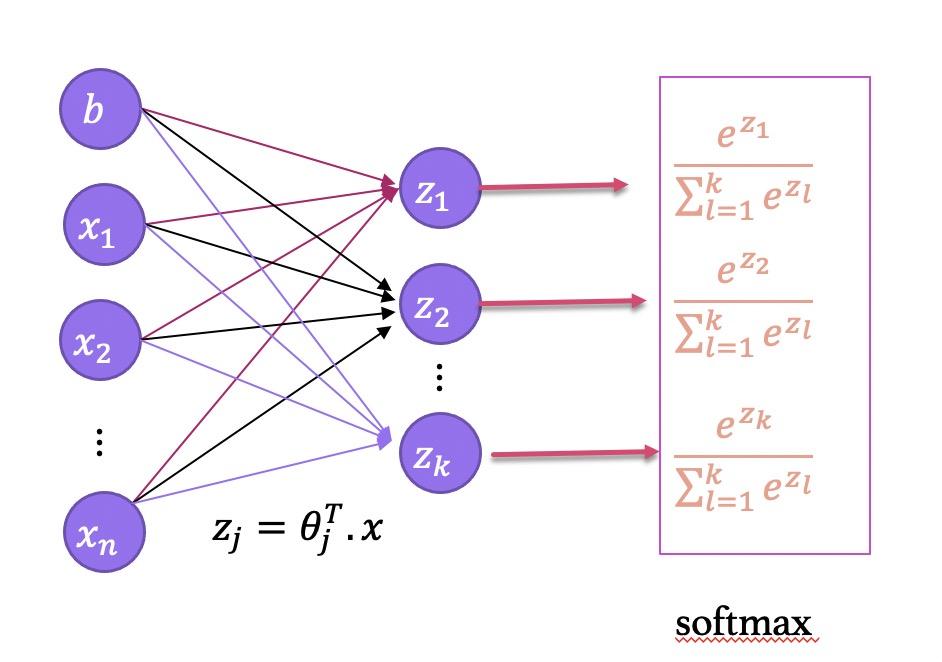
softmax 模型说明
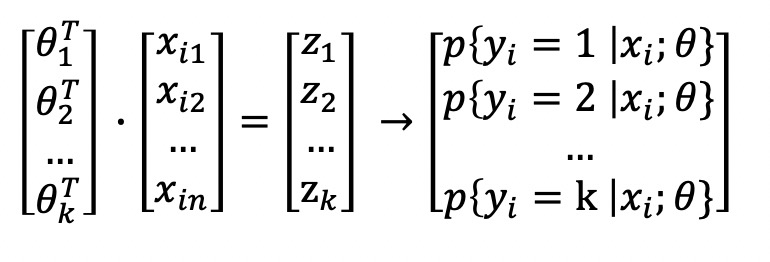
对输入数据 $\lbrace (x_{1}, y_{1}), (x_{2}, y_{2}), …, (x_{m}, y_{m}) \rbrace$有$k$个类别, 即 $y_{i} \in \lbrace 1, 2, …,k \rbrace$, 那么 softmax 回归主要估算输入数据 $x_{i}$ 归属于每个类别的概率, 即
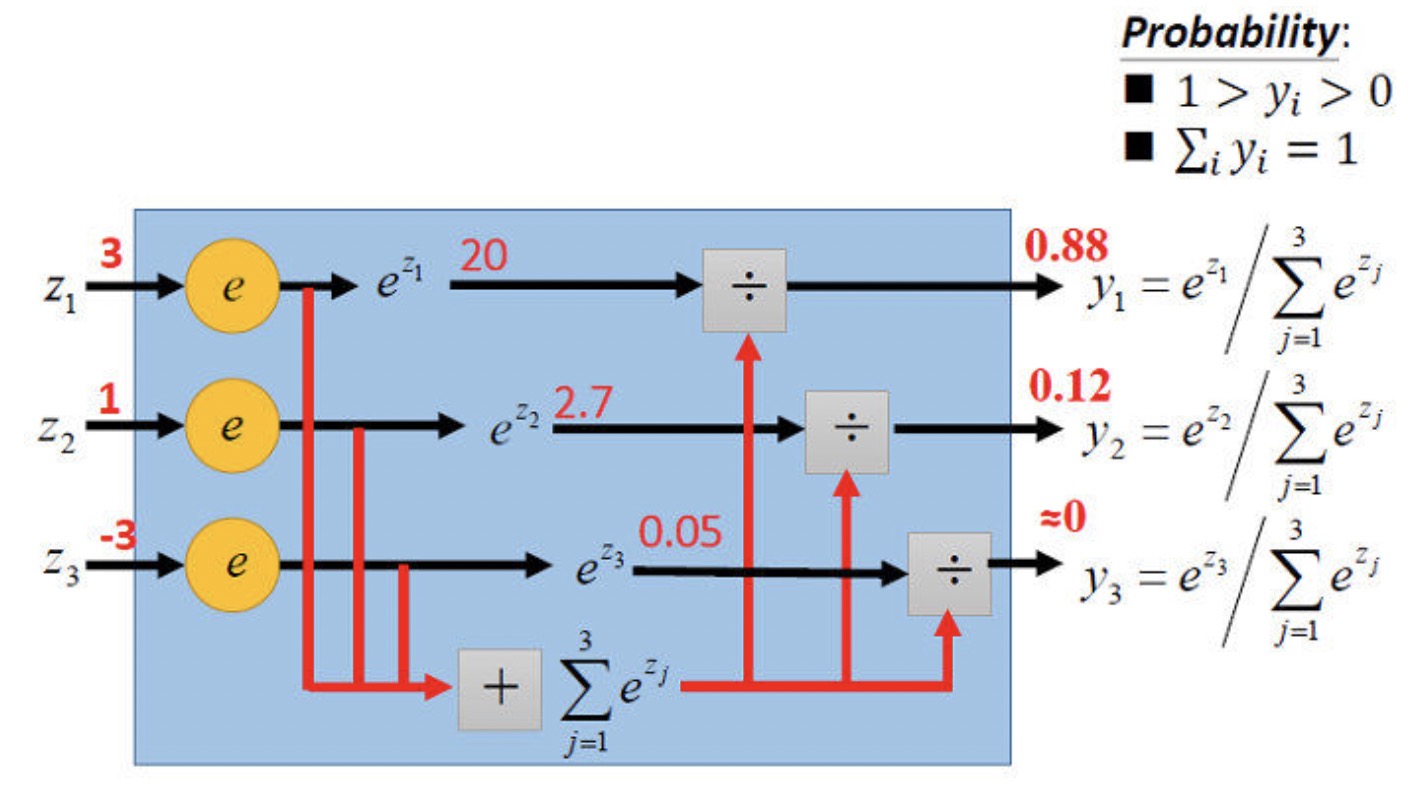
其中, $\theta_{1}, \theta_{2}, …, \theta_{k}$ 是模型的参数, 乘 $\frac{1}{ \sum_{j=1}^{k} e^{\theta_{j}^{T}x_{i}} }$ 是为了归一化, softmax 将输入数据 $x_{i}$ 归属于类别 $j$ 的概率为
\[p(y_{i}=j|x_{i};\theta) = \frac{e^{\theta^{T}_{j}x_{i}}}{\sum_{l=1}^{k}e^{\theta^{T}_{l}x_{i}}}\]对于这个样本的联合分布概率,引入则可以表示为:
这里的 $1 \cdot \lbrace y_i=j \rbrace$ 为示性函数, 当 $1{true} = 1$, $1{false} = 0$
引入极大似然函数
定义损失函数为:
梯度下降法
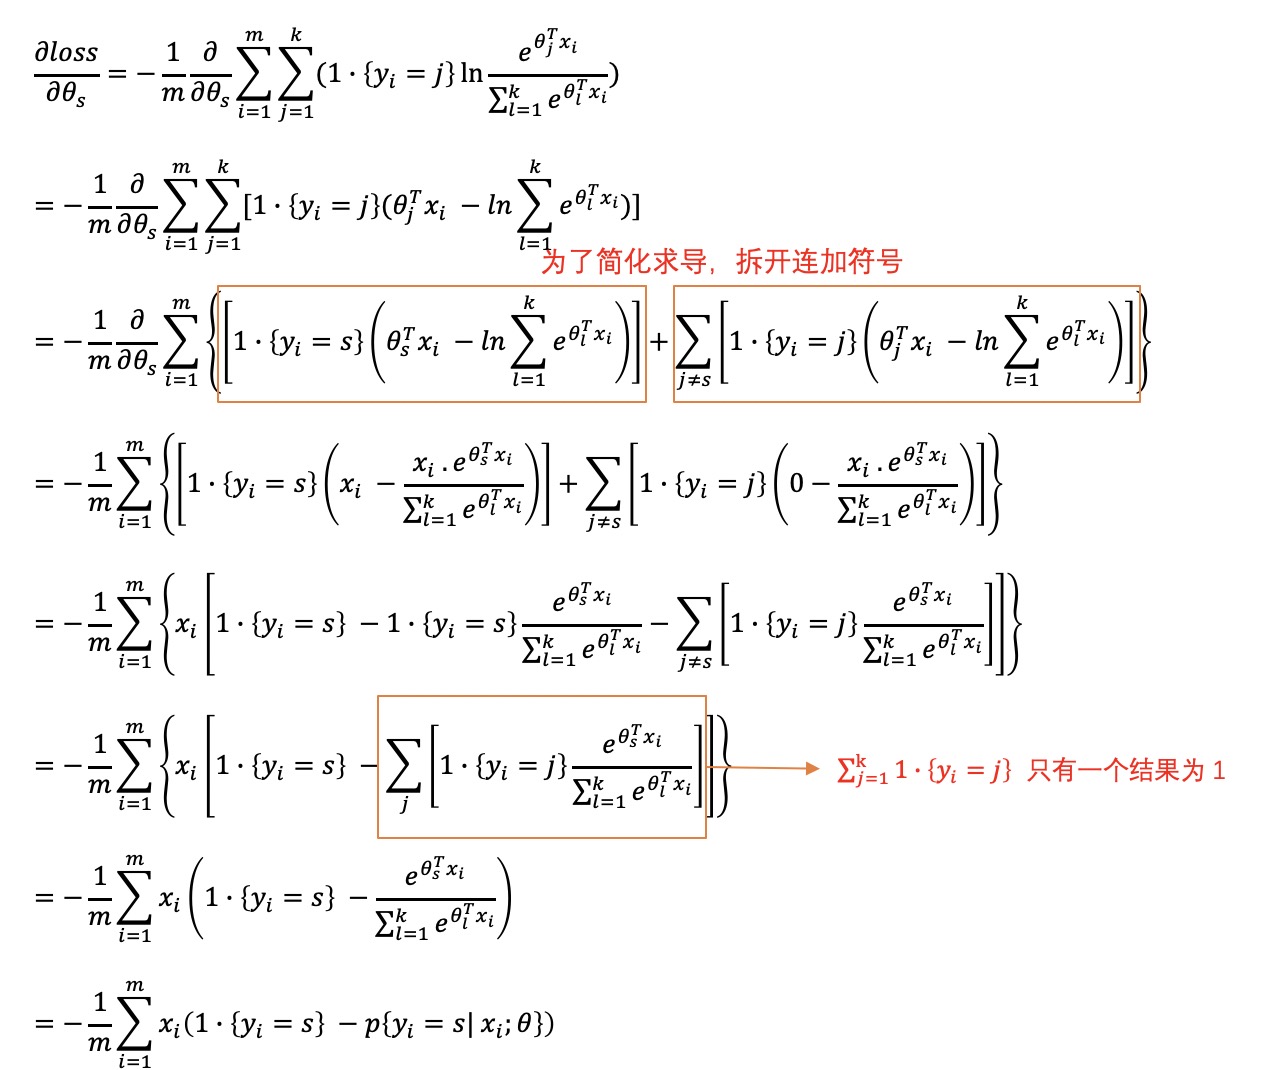
使用梯度下降法计算过程为
优化方式
\[\theta_{s} := \theta_{s} - \alpha \frac{1}{m} \sum_{i=1}^{m} x_i (1 \cdot \lbrace y_i =s \rbrace - p \lbrace y_i =s | x_i; \theta \rbrace )\]代码实例
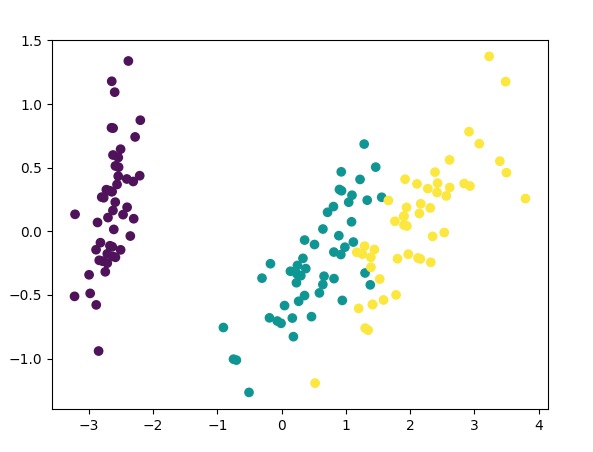
使用莺尾花数据集做一个demo,数据降维分布情如下 :
工具包
1
2
3
4
5
6
import numpy as np                                             # 矩阵工具
import matplotlib.pylab as plt                                 # 绘图工具
from sklearn.datasets import load_iris                         # 莺尾花数据集
from sklearn.decomposition import PCA                          # PCA 降维
from sklearn.model_selection import train_test_split           # 切分训练测试样本集
from sklearn.preprocessing import OneHotEncoder                # onehot 编码
因为是多分类问题, 我们使用 onehot 编码将莺尾花标签切转化为3个分量的向量,方便进行矩阵运算
\[\frac{e^{\theta^{T}_{j}x_{i}}}{\sum_{l=1}^{k}e^{\theta^{T}_{l}x_{i}}}\]softmax 函数
1
2
3
4
5
6
7
8
9
10
11
12
13
14
15
16
17
18
19
20
21
22
23
def softmax(weight:np, X:np, Y:np) -> tuple :
    """
    softmax 计算公式
    :param weight: 权重矩阵
    :param X: 样本矩阵
    :return: 预估值,与错误率
    """

    z = np.e ** (np.dot(weight.T, X.T).T)

    print(z.shape)

    z_sum = np.sum(z, axis=1).reshape((-1,1))

    p = np.divide(z, z_sum)

    # 计算准确率
    Y_max = np.argmax(Y,axis=1)
    p_max = np.argmax(p, axis=1)

    precision = Y_max[Y_max == p_max].shape[0] / Y_max.shape[0]

    return p, precision
训练模型
1
2
3
4
5
6
7
8
9
10
11
12
13
14
15
16
17
18
19
20
21
22
23
24
25
26
27
28
29
30
31
32
33
34
35
36
37
38
39
40
41
42
43
44
45
46
47
def model(X:np, Y:np) -> np:
    """
    :param X: 样本特征
    :param Y: 样本标签
    :return:
    """
    sample_count = X.shape[0]
    v_count = X.shape[1]
    classes = Y.shape[1]
    itera = 500          # 训练次数
    step_count = 15      # 步长
    alpha = 0.001        # 学习率
    lamd = 0.0005

    # 初始化权重矩阵
    weight = np.random.rand(v_count, classes)

    for _ in range(itera) :
        sum_pression = 0.0

        for step in range(step_count) :
            # 截取样本
            sample_stemp_pre_count = int(sample_count / step_count)
            sample_min = step * sample_stemp_pre_count
            sample_max = min((step + 1) * sample_stemp_pre_count, sample_count)
            sample_stemp_count = sample_max - sample_min

            # print(sample_min, sample_max)

            sample_x = X[sample_min:sample_max, :]
            sample_y = Y[sample_min:sample_max, :]

            # 计算偏差
            p, pression = softmax(weight, sample_x, sample_y)

            sum_pression = sum_pression + pression
            loss =  sample_y - p

            # 计算梯度

            grad = - np.divide(np.dot(sample_x.T, loss), sample_stemp_count)

            weight = weight - alpha * grad + lamd * weight

        print("pression : {0}".format(sum_pression/step_count))

    return weight
执行方法
1
2
3
4
5
6
7
8
9
10
11
12
13
14
15
16
17
18
if __name__ == '__main__':
    iris = load_iris()

    X = iris.data
    Y = iris.target

    Y = Y.reshape((-1, 1))

    # 加一个偏置
    X = np.column_stack((X, np.linspace(1,1, X.shape[0])))

    Y = OneHotEncoder().fit_transform(Y).toarray()

    train_x, test_x,  train_y, test_y = train_test_split(X, Y, test_size=0.25)

    weight = model(train_x, train_y)

    test_data(weight, test_x, test_y)
参考资料:
本文由作者按照 CC BY 4.0 进行授权

